
WindoViews — Jared
WindoTrader Subscriber Builds: Jared P. (MI)
Today’s ‘build’ comes from Jared, an independent trader in Michigan. Jared has traded futures for over 15 years and the Forex since 2004. Like most traders, he has experienced the highs and lows of trading and has a great attitude in looking at each of the lows as valuable learning experiences. Jared began using the Market Profile in his trading about 4 years ago, and has not looked back.
This is one of Jared’s charts on the e-mini S&P.
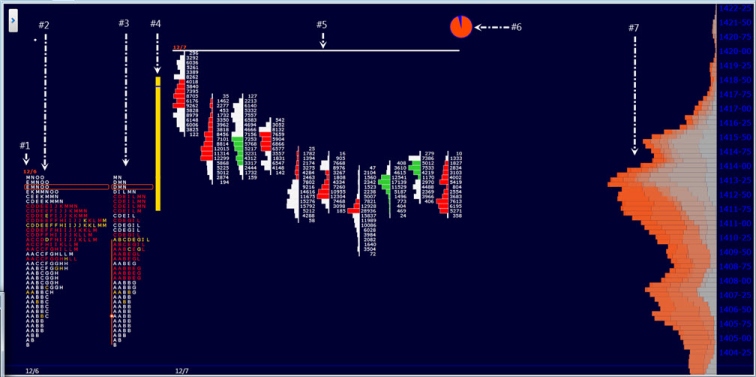
The objects and parts used in this chart are:
A TPO-driven Market Profile using 15 minute time periods. Its color scheme consists of white, red, and gold. The default TPO color is white. Red is the high volume TPO color while both the dynamic TPO-POC and the session TPO-POC are colored gold. The high volume percentage is 50%. This profile, in 15 minute periods emphasizes the prior session’s TPO distribution as well as the areas of the highest 50% of TPO volume. Based on how Jared configured the high volume on the profile, he elected to make the traditional value area transparent.
This Market Profile’s underlying dataset is contract volume with each period set to 100,000 contracts. The color scheme and high volume percentage are the same as used on #2, the TPO dataset driven profile. This profile is designed to emphasize instances of sharp volume fluctuations. Value area setting is transparent.
This object, a summary bar, represents trades from 1700 to 0930 EST. Jared uses this to quickly reference the overnight’s high and low. The initial balance, medium volume, and high volume all set to transparent.
This U-Bar Object contains two U-Bar Parts. First, a histogram based on 15 minute periods. The histograms (volume profiles) have been reversed and colored based on a Candlestick so Jared can graphically monitor not only the volume distribution as it develops but also the periods current price and close in relation to the period’s open. And second, the periods data values (contract volume) at price.
A proximity period indicator for the 15 minute period and a cumulative profile colored according to the distribution of sessions is displayed.
To see these and other displays ranging from simple to complex and learn more about how WindoTrader can benefit and potentially give you an edge, go here and a WindoTrader Team member will contact you, answer your questions, and provide a personalized ‘guided Tour’ of this functionality.
Thank you for all of your feedback, ideas, and suggestions as we consistently strive to fulfill our Purpose – “To develop software and provide support that makes a positive difference . . .”
—The WindoTrader Team