
WindoViews — Overlay Charts
Feature of the Month: WindoTrader’s Overlay Charts.
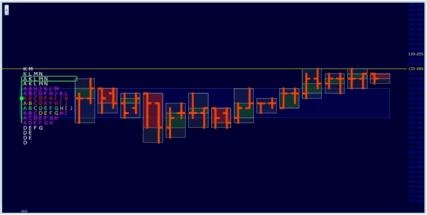
An overlay chart is a chart comprised of two or more session objects. Session objects defined as a Market Profile, Candlesticks, OHLC Bars, DataValues, Histograms or Volume Profiles, etc..
Their primary benefit is the display of both contextual (higher timeframe) and detailed (lower timeframe) information on the same display. While these displays or charts are more complex, the user always has the choice of the granularity of information displayed.
Here is an example of a 30 minute Candlestick with two 15 minute OHLC Bars in each candlestick. Note how the 30 minute Candlesticks are one-timeframing up while the 15 minute OHLC Bars executed a retest-failure offering a potential opportunity.
To see other overlay displays ranging from simple to complex and learn more about how WindoTrader can benefit and potentially give you an edge, go here and a WindoTrader Team member will contact you and answer your questions and/or provide a personalized ‘guided Tour’ of this functionality.
Thank you for all of your feedback, ideas, and suggestions as we consistently strive to fulfill our Purpose – “To develop software and provide support that makes a positive difference . . .”
—The WindoTrader Team