
WindoViews — Karl
WindoTrader Subscriber Builds: Karl S. (NC)
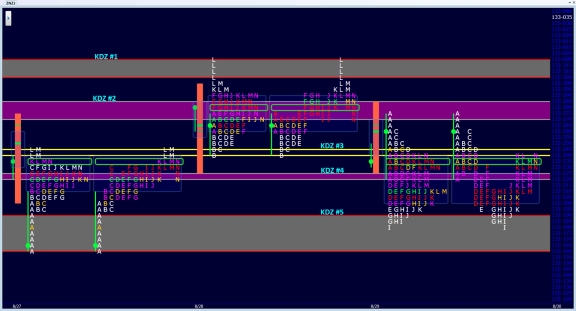
This month’s ‘build’ is from Karl showing how he distinguishes different key decision zones on his screens. Because he knows that different zones have varying degrees of importance, he uses a few colorful backgrounds and borders for his zones including three specific horizontal line colors.
To see how Karl marks his zones for the current session, look at his display as well as the display’s legend:
Display Legend:
- Highlights the previous session’s ‘L’ period sell tail (132-305 to 133-000) using a dark gray zone with red borders.
- Highlights the previous session’s Point of Control (132-270) up to the current session’s previous overnight high (132-285) using a purple zone with gray borders.
- Highlights the high of the first session and the low of the second session.
- Highlights the August 27th session’s Point of Control (132-220) up to the current session’s previous overnight low (132-225) using a purple zone with gray borders.
- Highlights the first session’s ‘A’ period buy tail (132-160 to132-190) using a dark gray zone with red borders.
Color Legend:
- Dark gray zones with red borders designate buy tails; sell tails, and single prints inside of a session’s range.
- Purple zones with gray borders designate POC closest reference point. Yellow lines are minor areas of reference.
Thank you for all of your feedback, ideas, and suggestions as we consistently strive to fulfill our Purpose – “To develop software and provide support that makes a positive difference . . .”
— The WindoTrader Team